 Tempo aproximado para leitura: 7 minutos
The main objective of the Graph Viewer is to allow other applications to display customized graph within Fluig. In order to do that, the application just has to register your graph service in Fluig and provide two rest methods. One that will provide the configuration parameters of the graph, and another that will provide the data.
The Graph Viewer allows to display in the following formats: table, column chart and pie chart.


1. Register the data service in Fluig.
To register the graph data service, just send an asynchronous message to Fluig.
The developer must use the event "REGISTER_CHART_SERVICE". You need to pass an object type ChartServiceVO with the data of the data service in question.
The object ChartServiceVO, available in package
com.totvs.technology.wcm.common.chart, is composed by the following
elements:
String
id: graph service code
String
description: graph service description
String
ParametersRest: URL of the rest service that will return the
parameters
String
dataRest: URL of the rest service that will return the graph data
Example:
ChartServiceVO ecm1 = new ChartServiceVO("ECM1", "ECM - Volumes: Space
Used (Per Volume in %)");
ecm1.setDataRest(“http://localhost:8080/portal/ecm/api/rest/ecm/volume/chartDataByVolume");
ecm1.setParametersRest(“http://localhost:8080/portal/ecm/api/rest/ecm/volume/chartParametersByVolume");
IntegrationUtil.sendAsyncMessage(WCMAsyncEvents.REGISTER_CHART_SERVICE.getEvent(),
ecm1);
This record must be run each time the application is deployed, that is, every time Fluig is up. In order to do that, we suggest that a servlet is created in your application with the option loadOnStartup = 1, which will perform this task.
2. Parameter Services
This
rest service must return a list of ChartParameterVO, which will
contain the parameters that your data service will need to supply the
graph data. Based on this service, Fluig will build the configuration
screen.
ChartParameterVO
(com.totvs.technology.wcm.common.chart package) is composed by the
following elements:
int code
id: sequential numeric code that will be used for subsequent data
search
String
title: field name as it will appear on the screen
String
type: field type (ChartParameterVO.TYPE_STRING,
ChartParameterVO.TYPE_NUMBER, ChartParameterVO.TYPE_DATA or
ChartParameterVO.TYPE_BOOLEAN)
String
AllowedList:iIf the field is of the string type, options can be
provided for the user to select from a list. These options are
separated by ";"
boolean
multipleSelection - > true/false, if it allows multiple selection or
not, if AllowedList is in use
String
value - > Initial value, if any
Example:
List<ChartParameterVO>
params = new ArrayList<>();
ChartParameterVO
param1 = new ChartParameterVO();
param1.setCode(1);
param1.setTitle("Código
do Item");
param1.setType(ChartParameterVO.TYPE_STRING);
param1.setAllowedList(“Item
1;Item 2;Item 3”);
param1.setMultipleSelection(ChartParameterVO.SELECTION_UNIQUE);
params.add(param1);
ChartParameterVO param2 = new ChartParameterVO();
param2.setCode(2);
param2.setTitle("Display
only active items");
param2.setType(ChartParameterVO.TYPE_BOOLEAN);
params.add(param2);
return params;
3. Data Service
The REST
service must return a ChartVO,
with the data to display the graph.
ChartVO
(com.totvs.technology.wcm.common.chart package) is composed by the
following elements:
String
title: title that will be displayed in the graph
String
description: graph description
String
type: graph type (ChartTypes.column.getName(),
ChartTypes.pie.getName(), ChartTypes.table.getName()
Map<String,
Object>[] source: graph data
ChartCategoryVO
category: categories
ChartSerieGroupVO[]
seriesGroups: groups of series
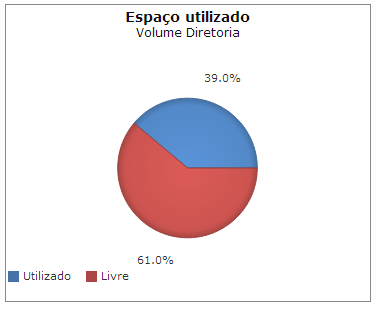
Example for a Pie chart:
ChartVO result = new ChartVO("Espaço utilizado", "Volume " +
codVolFisic,ChartTypes.pie.getName());
Map<String,
Object>[] source = new Map[2];
Map<String,
Object> data0 = new HashMap<String, Object>();
data0.put("label","Utilizado");
data0.put("size",80);
source[0] =
data0;
Map<String, Object> data1 = new HashMap<String, Object>();
data1.put("label","Livre");
data1.put("size",20);
source[1] =
data1;
result.setSource(source);
ChartSerieGroupVO[] seriesGroups = new ChartSerieGroupVO[1];
ChartSerieGroupVO
serieGroup = new ChartSerieGroupVO(ChartTypes.pie.getName(),"label");
ChartSerieVO[]
series = new ChartSerieVO[1];
ChartSerieVO
serie = new ChartSerieVO("size","label");
series[0]
= serie;
serieGroup.setSeries(series);
seriesGroups[0]
= serieGroup;
result.setSeriesGroups(seriesGroups);
return result;
Example for a Column chart:
ChartVO result
= new ChartVO("Espaço utilizado","Todos os
volumes",ChartTypes.column.getName());
Map<String, Object>[] source = new Map[2];
Map<String, Object> data0 = new HashMap<String, Object>();
data0.put("label",”Item
1”);
data0.put("total",100);
data0.put("used",40);
data0.put("free",60);
source[0] =
data0;
Map<String, Object> data0 = new HashMap<String, Object>();
data0.put("label",”Item
2”););
data0.put("total",120);
data0.put("used",60);
data0.put("free",60);
source[1] =
data0;
result.setSource(source);
ChartCategoryVO category = new ChartCategoryVO("label");
result.setCategory(category);
ChartSerieGroupVO[] seriesGroups = new ChartSerieGroupVO[1];
ChartSerieGroupVO
serieGroup = new
ChartSerieGroupVO(ChartTypes.column.getName(),"Espaço(Mb)");
ChartAxiVO axis = new ChartAxiVO(20,true,"Espaço(Mb)");
serieGroup.setValueAxis(axis);
ChartSerieVO[] series = new ChartSerieVO[3];
ChartSerieVO total = new ChartSerieVO("total","Espaço Total");
series[0]
= total;
ChartSerieVO used = new ChartSerieVO("used","Espaço Utilizado");
series[1]
= used;
ChartSerieVO free = new ChartSerieVO("free","Espaço Livre");
series[i] =
free;
serieGroup.setSeries(series);
seriesGroups[0]
= serieGroup;
result.setSeriesGroups(seriesGroups);
return this.buildResponse(result);
Example for a Table chart:
ChartVO result = new ChartVO("Espaço utilizado","Todos os volumes",ChartTypes.table.getName());
Map<String, Object>[] source = new Map[2];
Map<String, Object> data0 = new HashMap<String, Object>();
data0.put("label",”Item
1”);
data0.put("total",100);
data0.put("used",40);
data0.put("free",60);
source[0] =
data0;
Map<String, Object> data0 = new HashMap<String, Object>();
data0.put("label",”Item
2”););
data0.put("total",120);
data0.put("used",60);
data0.put("free",60);
source[1] =
data0;
result.setSource(source);
ChartSerieGroupVO[] seriesGroups = new ChartSerieGroupVO[1];
ChartSerieGroupVO serieGroup = new ChartSerieGroupVO(ChartTypes.table.getName(),"Espaço(Mb)");
ChartAxiVO axis = new ChartAxiVO(20,true,"Espaço(Mb)");
serieGroup.setValueAxis(axis);
ChartSerieVO[] series = new ChartSerieVO[4];
ChartSerieVO label = new ChartSerieVO("label","Item");
series[0] =
label;
ChartSerieVO total = new ChartSerieVO("total","Espaço Total");
series[1]
= total;
ChartSerieVO used = new ChartSerieVO("used","Espaço Utilizado");
series[2]
= used;
ChartSerieVO free = new ChartSerieVO("free","Espaço Livre");
series[3] =
free;
serieGroup.setSeries(series);
seriesGroups[0]
= serieGroup;
result.setSeriesGroups(seriesGroups);
return this.buildResponse(result);
Visão Geral
Import HTML Content
Conteúdo das Ferramentas
Tarefas