Páginas filhas
  • Chart of Returns by Period

01. OVERVIEW

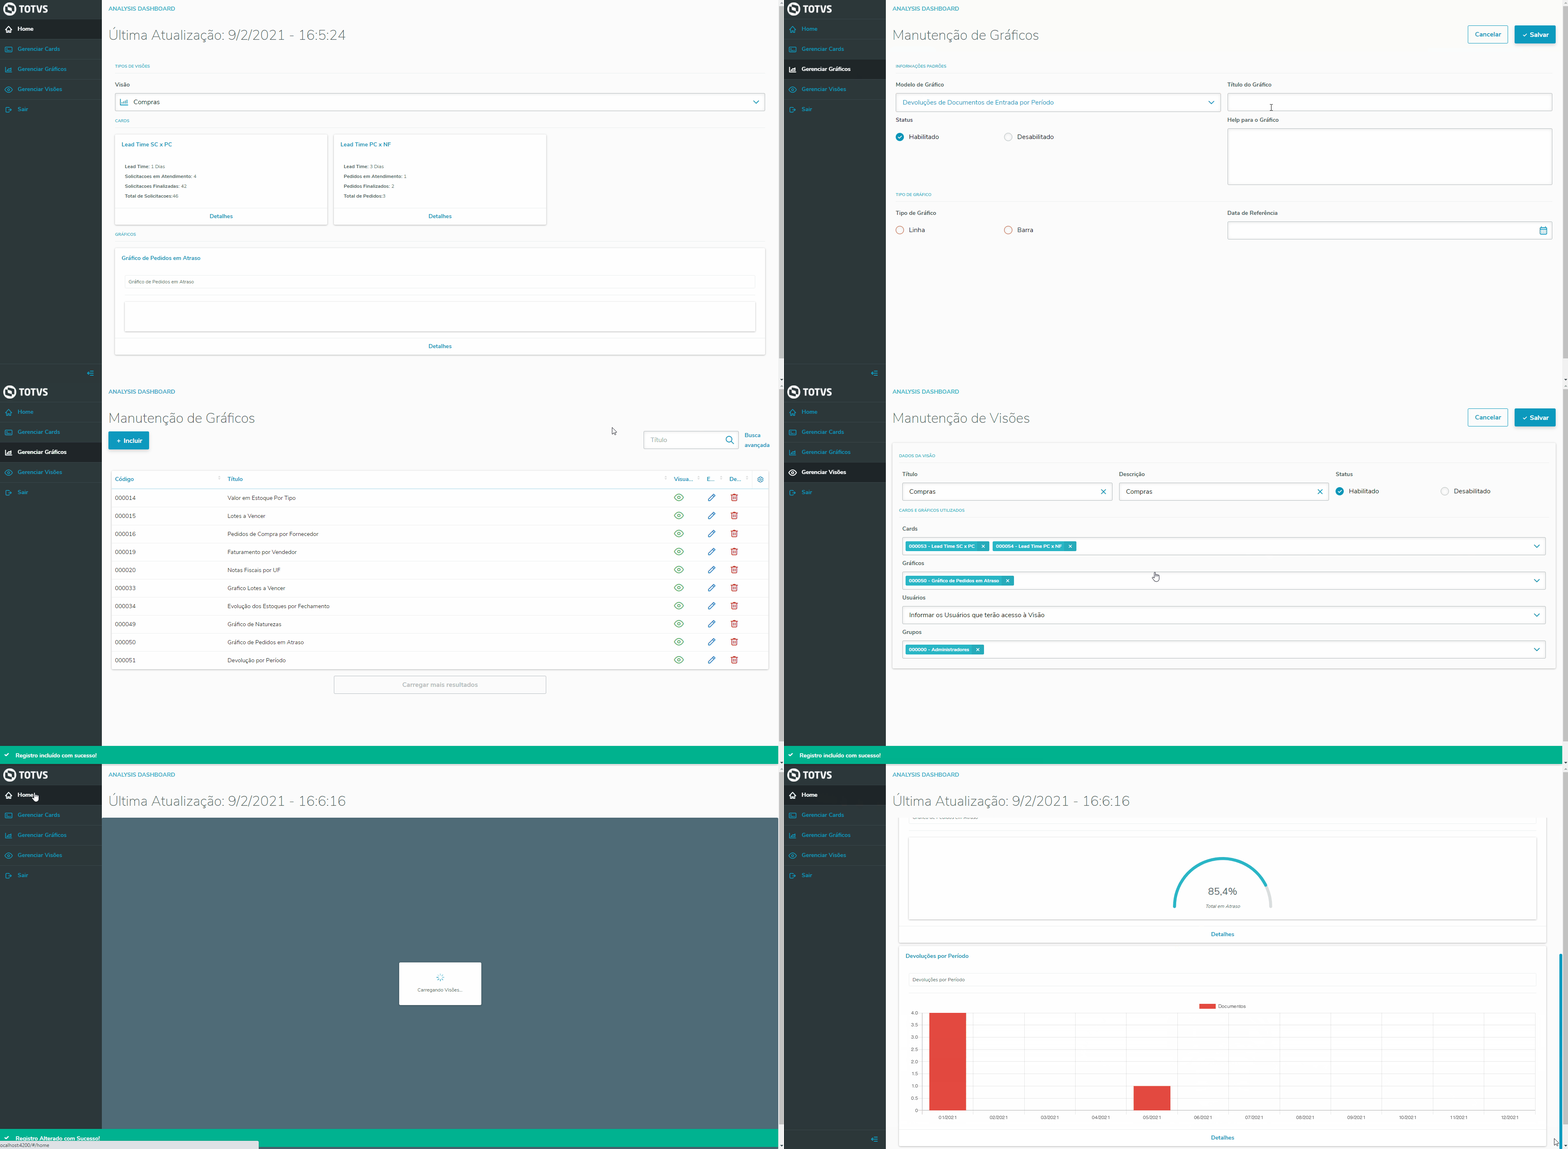
The chart Returns by Period shows the Return Documents and their respective returned products in a period of 12 months.

02. EXAMPLE OF USE


Practical example of the process using Protheus

To add a new chart of Returns by Period:

1) Click the menu Manage Charts.

2) Click Add.

3) Fill out the fields in the following sequence:

a) Chart Template: Returns of Incoming Documents by Period.

b) Chart Title: Enter a title for the Chart.

c) Status: Enabled.

d) Chart Help: Use this feature to enter a help description for the chart.

e) Chart Type:  Select a chart type, whether line or bar chart.

f) Reference Date: You can select the period from which to get the data. The field is not required. If the user does not fill it out, the system uses the date selected upon system login.


To Edit a Chart:

1) Click the menu Manage Charts.

2) Select the chart Returns by Period.

3) Edit any data you want.

4) Click Save to finish the operation:


To use the chart of Line type, configure it as shown below:

1) Click the menu Manage Charts.

2) Click Add.

3) Fill out the fields in the following sequence:

a) Chart Template: Incoming Documents by Period.

b) Chart Title: Enter a title for the Chart.

c) Status: Enabled.

d) Chart Help: Use this feature to enter a help description for the chart.

e) Chart Type:  Select Line.

f) Reference Date: You can select the period from which to get the data. Field not required.

Example:


To use the chart of Bar type, configure it as shown below:

1) Click the menu Manage Charts.

2) Click Add.

3) Fill out the fields in the following sequence:

a) Chart Template: Incoming Documents by Period.

b) Chart Title: Enter a title for the Chart.

c) Status: Enabled.

d) Chart Help: Use this feature to enter a help description for the chart.

e) Chart Type:  Select Bar.

f) Reference Date: You can select the period from which to get the data. Field not required.

Example:


When you click the Details button on the chart, the system displays a list with the items that compose the Return Documents in a 12-month period. You can also check the products of a given Document by selecting its number.

The tool will always load a list with a gap every 10 items.

Example:


The first level of the chart displays the Return Documents in a 12-month period; however, you can check the specific products of a given period.

To check the products that correspond to a specific period, just click the period desired for the chart to display a second level of the period selected. The Details button lists only the products of this period.

Example:


03. OTHER INFORMATION

  • None available.

04. RELATED TOPICS