Index
Objective
The objective of this guide is to describe the development, post and view of reports in TOTVS Fluig Platform. To have a better understanding, a user report example will be detailed.
Development Environment
For developing reports, you need to have Java™ JDK/JRE higher than 1.6. Address for download: http://java.sun.com/javase/downloads/index.jsp.
TOTVS Fluig Platform uses BIRT as a report execution engine. For this reason, in order to develop reports, you should use the BIRT standard and methodology.
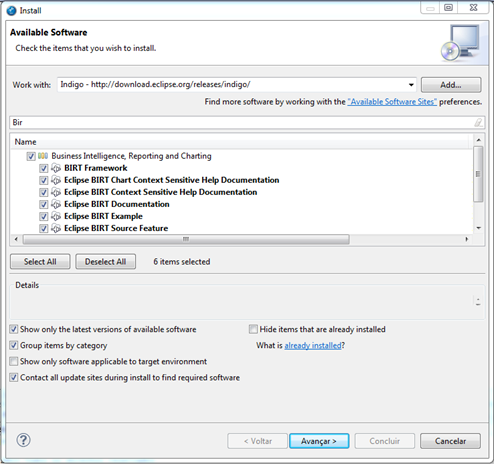
It is recommended to use the BIRT Report Designer to develop reports for TOTVS Fluig Platform. BIRT can be integrated into Studio or Eclipse (already installed for use of Fluig Studio, according to the Fluig Studio Installation Guide), just install BIRT plug-in. I n order to do that, you need to access the Help-> Install New Software option and follow these procedures:
- Work with: Select Indigo.
- Search: After listing BIRT options, enter Birt in the search field.
- Select the Business Intelligence, Reporting and Charting check box.
- Then click Next.
BIRT Report Designer has several features that assist in developing reports. Among them are: layout adjustment, data access configuration, and report formatting.
SaaS Environment Security
In case Fluig is executed in SaaS environment, it is not recommended the use of reports, since it is possible to create reports that return information from other companies via JPQL or Dataset query. To ensure non-execution, it is necessary to define the true value for the variable SaaS located at: %JBOSS_HOME%\jboss-as-7.2.0.Final\standalone\configuration\standalone.xml. E.g.:
<simple name="java:global/webdesk/SaaS" value="true"/>
Direct connection to the database
It is possible to post reports that communicate directly with the database.
Use the settings below in your report, paying attention to the values of the 'odaDriveClass' and 'odaURL' properties.
To make direct connection to the SQLServer database, you must use the following standard:
SQLServer
<property name="odaDriverClass">com.microsoft.sqlserver.jdbc.SQLServerDriver</property>
<property name="odaURL">jdbc:sqlserver://IP:1433;databaseName=DATABASE</property>
To make direct connection to the MySQL database, you must use the following standard:
MySQL
<property name="odaDriverClass">com.mysql.jdbc.Driver</property>
<property name="odaURL">jdbc:mysql://IP:3306/databaseName=DATABASE</property>
Developing a User report
Through BIRT Report Designer, you can create various reports for Fluig, access data from the product database via JPA, JDBC query. You can access other products data through JDBC connection, Web Service, or XML files.
To make it easy to understand the development of Fluig reports, we will show an example about creating reports. Following are the steps required for creating the user report with data provided from Fluig through query via dataset. The source of the mentioned example can be downloaded from the following link:
Creating a new project and a new report
Open the tool in which you installed BIRT Report Designer plug-in to follow the step by step. In the example we will use Fluig Studio.
- In the previously created Fluig project, right click the reports folder, and then click New -> Fluig Report.
- Then simply provide the Report Name and click Finish.

Figure 1 - Creation of report in Fluig project.
Configuring access to data
A Data Source is a mechanism that keeps the connection data to the data source, for example, JDBC, Web Service settings, among others. For this report, we will use access to data via JavaScript language.
Follow these steps:
- When creating the new report, select the Report Design view and then the Data Explorer tab, right click the Data Source item and then select the New Data Source option.
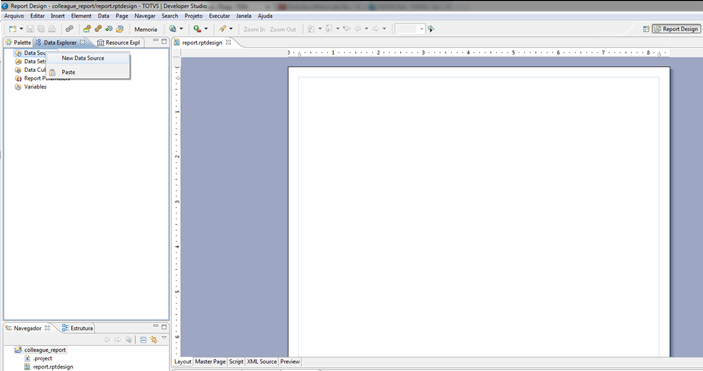
Figure 5 - New Data Source.
- When opening the New Data Source window, select the Scripted Data Source option and define the name dsColleague as the Data Source Name, then click Finish.
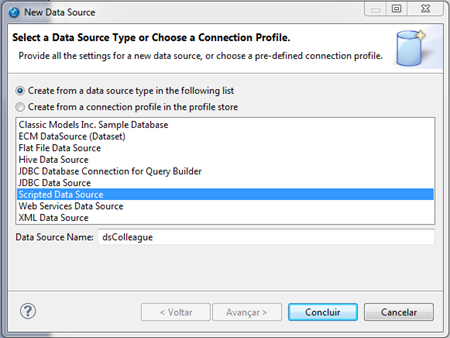
Figure 6 - Data Source Type.
In the Data Explorer tab, right click Data Sets item, then click the New Data Set option, as shown in figure 7. Data Set is a BIRT temporary table in which Data Source data is stored and rendered in the report.

Figure 7 - New Data Set.
When opening the New Data Set window, define colleagueDataSet as the Data Set Name, click on the Next button, in Output Columns, click on the Add button and add all the DataSet records. Next, click on the Finish button.
Column Name |
Data Type |
Column Alias |
Display Name |
colleagueId |
String |
Blank |
Blank |
Login |
String |
Blank |
Blank |
colleagueName |
String |
Blank |
Blank |
String |
Blank |
Blank |
|
active |
String |
Blank |
Blank |
adminuser |
String |
Blank |
Blank |

Figure 8 - Data Set Columns.
Adding parameters to the Report
You can add parameters to the report being requested for the user prior to its rendering, assisting in data query filter generating a specific report. Follow these steps:
- Select the Data Explorer tab, then right click the Report Parameters item, select the New Parameter option.
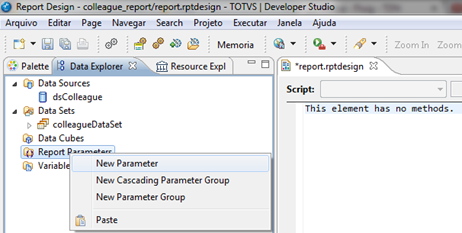
Figure 9 - Report Parameters.
Figure 10 illustrates the parameter addition window.
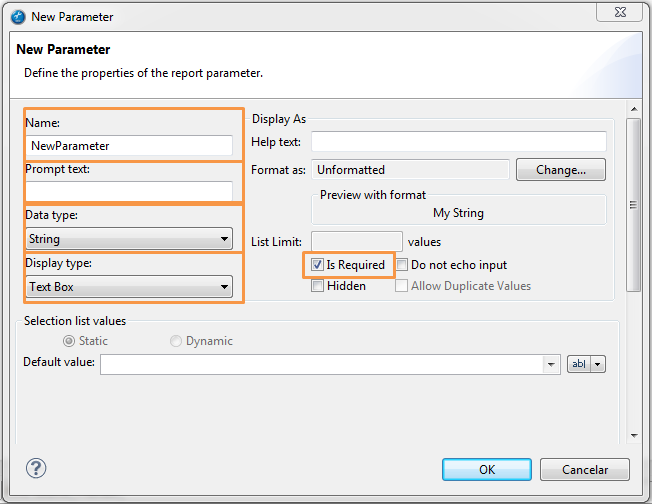
Figure 10 - Parameter configuration.
When you open the New Parameter window, add the following parameters:
Registration
|
Field
|
Value
|
|---|---|
| Name | Registration |
| Prompt text | User Registration or "*" to display all |
| Data type | String |
| Display type | Text Box |
| Is Required | true |
Mostra Usuários
|
Field
|
Value
|
|---|---|
| Data type | String |
| Display type | List Box |
| Is Required | true |
| Name | paramEnable |
| Prompt text | Display users |
Selection Values
|
Value
|
Display Text
|
|---|---|
| * | All |
| true | Active |
| false | Inactive |
Order by
|
Field
|
Value
|
|---|---|
| Name | paramSort |
| Prompt text | Order by |
| Data type | String |
| Display type | List Box |
Selection Values
|
Value
|
Display Text
|
|---|---|
| c.colleaguePK.colleagueId | Registration |
| c.colleagueName | Name |
| c.login | Login |
TAGs
Fluig offers substitution TAGs to assist in the development and security of generation report information, those being:
• ${WKCompany}: substitutes the variable by the authenticated company code in TOTVS Fluig Platform.
• ${WKUser}: substitutes the variable by the authenticated user code in TOTVS Fluig Platform.
TAGs are useful in the events when information should only be generated about the company in which the user is authenticated, or in reports that show only information about the authenticated user in TOTVS Fluig Platform.
Populating the Data Set
In the example presented in this document, the report will be populated with data provided from JPA queries accessing TOTVS Fluig Platform database. However, you can use other resources to populateData Set: XML, Web Service and JDBC.
BIRT renders the report through the execution of its events. There are many events provided by BIRT, in this example we will use:
- initialize: first event fired by BIRT, it is recommended to use this event to import libraries and start variables;
- beforeOpen: event fired before BIRT opens the connection to the data source (Data Source);
- fetch: event fired by BIRT after searching for each record in the Data Set and before applying the filters and calculated fields.
Through the events, it is possible to develop query logic and data generation via JavaScript programming language. In addition to that, it is possible to use several Java™ language resources and libraries.
- Select the Script tab in the report page, and then select the initialize event, add the following code as shown in figure 11:
importPackage(Packages.com.datasul.technology.webdesk.dataset.service);
importPackage(Packages.com.datasul.technology.webdesk.dataset);
importPackage(Packages.com.datasul.technology.webdesk.search.controller);
importPackage(Packages.java.util);
var count = 0;
var dataset = null;
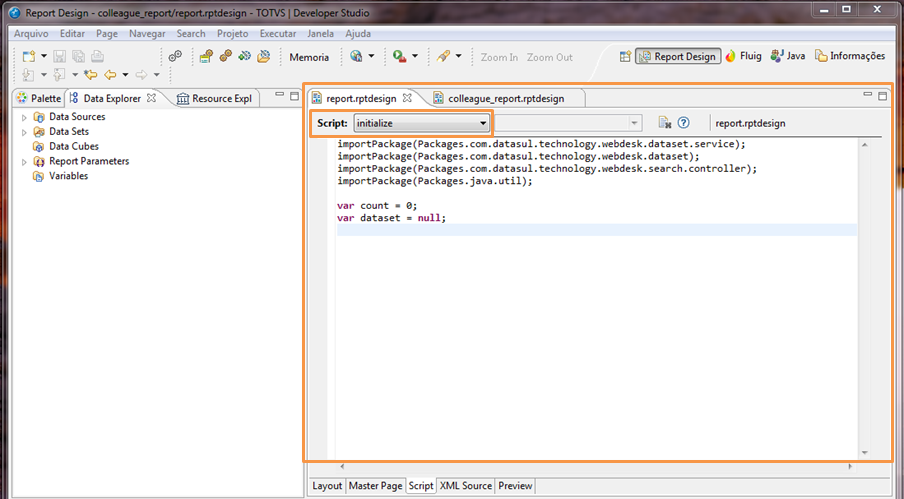
Figure 11 - initialize Event.
The above code imports the Java™ libraries and the library provided by Fluig to query the product data, in addition to starting the variables used by the report.
Details about the code:
-
- importPackage: command responsible for importing Java™ libraries.
- Package.java.util: library responsible for Java™ utils Classes.
- Packages.com.datasul.technology.webdesk.dataset.service: library provided by Fluig to query the product database.
- Select the Data Explorer tab, expand the Data Sets item and click on colleagueDataSet, then click the Script tab, select the beforeOpen event and add the following code as shown in figure 12.
try{
	var factory = DatasetFactory.getInstance(${WKCompany});
	var constraints = new Array();
	var sortingFields = new Array();
	var i = 0;

	//Filters only by registration of the user provided
	if(params["Registration"].value != null && params["Registration"].value != "*") {
		constraints[i] = factory.createConstraint("colleaguePK.colleagueId", params["Registration"].value, params["Registration"].value, ConstraintType.MUST);
		i++;
	}

	//Filters active if selected
	if(params["paramEnable"].value != null && params["paramEnable"].value != "*"){
		constraints[i] = factory.createConstraint("active", params["paramEnable"].value, params["paramEnable"].value, ConstraintType.MUST);
		i++;
	}

	//Orders according to selection
	if(params["paramSort"].value != null && params["paramSort"].value != "*"){
		sortingFields[0] = params["paramSort"].value;
	}

	//Dataset
	dataset = factory.getDataset("colleague", null, constraints, sortingFields);

}catch (e) {
}finally {
}
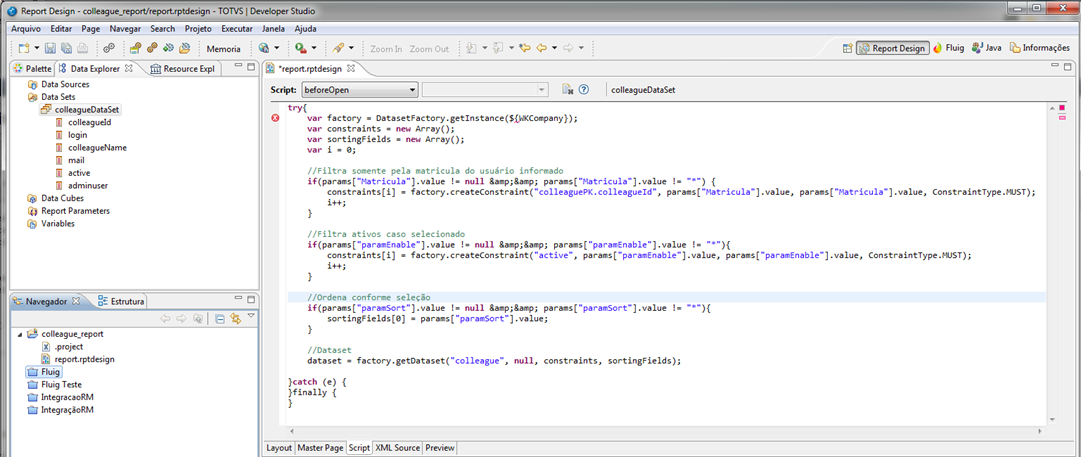
Figure 12 - BeforeOpen Event.
The above code mounts the report query by querying via dataset and adds the request filters according to the parameters defined by the user.
Details about the code:
- ${WKCompany}: TAG provided by Fluig, returns the company code in which the user is authenticated;
- params["Registration"]: report parameter, returns the registration code defined by the user;
- params["paramEnable "]: report parameter, returns user type;
- params["paramSort "]: report parameter, returns the ordering mode;
- To include the result of the query in the Data Set and format the report data, select the fetch event in the Script area and add the following code as shown in figure 13.
if (dataset != null) {
	if (count <	dataset.rowsCount){
		//mounts the line object
		row["colleagueId"] = dataset.getValue(count, "colleaguePK.colleagueId");
		row["login"] = dataset.getValue(count, "login");
		row["colleagueName"] = dataset.getValue(count, "colleagueName");
		row["mail"] = dataset.getValue(count, "mail");

		if(dataset.getValue(count, "active") == true){
			row["active"] = "Sim";
		}else{
			row["active"] = "Não";
		}

		//Updates the counter
		count++;
		return true;
	}
	return false;
}

Figure 13 - fetch Event.
Getting data via JDBC connection
An alternative way of obtaining data for creating reports is to use JDBC. You must create a Data Source that connects to the database. It will store the data for connection, via JDBC, to the database.
Select the Data Explorer tab, right click the Data Source item, then select the New Data Set option, as shown in figure 14.

Figure 14 - New Data Source
When you open the New Data Source window, select the JDBC DataSource option and define the name JDBC-DataSource as the Data Source Name, then click the Next button, according to figure 15.

Figure 15 - Data Source Type
In the next window, the connection to the database must be configured.
In the Driver Class field, select the connection driver to the database, in this case, the connection will be made with the MySQL® database. If the required driver is not listed, simply add it by clicking Managed Drivers...
Also provide the values for Database URL, User Name and Password according to the chosen database, as shown in figure 16.

Figure 16 – Configuring database connection.
In the Data Explorer tab, right click the Data Sets item, then click the New Data Set option.

Figure 17 – Creating New Data Set.
- Select the DataSource created (JDBC-DataSource), in the Date Set Type field, select SQL Select Query, enter a name for the Data Set and click next, as shown in figure 18.

Figure 18 - Configuring Data Set.
- On the next screen, enter the SQL that searches data in the database, in this example, the Fluig authenticated company volumes will be searched.
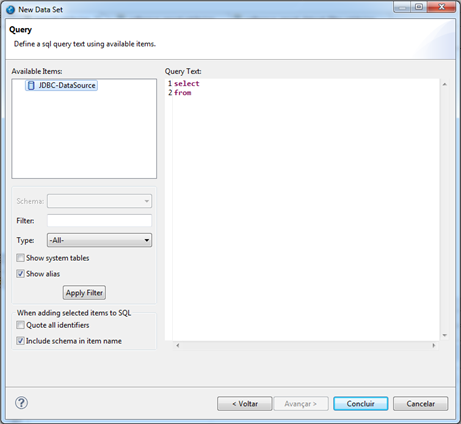
Figure 19 – Creation of SQL Query
The Query below searches the database for all the user company volumes authenticated in Fluig. This code is obtained by TAG ${WKCompany}.
SELECT vol_fisic.CD_VOL_FISIC,
         vol_fisic.COD_EMPRESA,
         vol_fisic.NOM_DIR_FISIC,
         vol_fisic.ID_TIP_VOL_FISIC
FROM vol_fisic
WHERE vol_fisic.COD_EMPRESA = ${WKCompany}
Nota
An error may occur when finishing the creation of the Data Set, since TAG ${WKCompany} does not exist in the BIRT context. The following figure shows the error that resulted from the use of the TAG, this is a syntax error in SQL and indicates that ${WKCompany} is not an SQL command. However when the report is executed in Fluig, it returns the company code as it should and, as a result, the TAG will be replaced by the company code of the user authenticated in Fluig, correcting the syntax error.
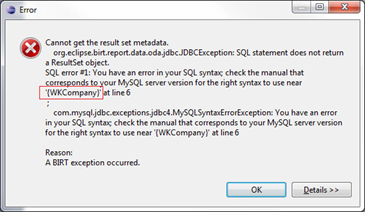
Figure 20 – Birt error for using TAG ${WKCompany}
Attention
Birt report creation using JDBC connection requires attention related to report post security in Fluig, since the .rptdesign file (XML of the Birt report) leaves the connection to the database parameters exposed. However, the password field is dimmed with base64. For this reason and for ease of searching Fluig information, we always recommend creating reports with data sources via Fluig Dataset or JPA query.
If reports need to be created using JDBC, we recommend that, when posting a report in Fluig, the permission settings are set to read-only. Users who have maintenance permission can download the attachments and will have access to the date connection to the database.
Formatting Report view
You need to add the report rendering components. Click on the Layout tab to view the report page that is blank and then select the Palette tab, as shown in figure 21.

Figure 21 – Blank report.
On the Pallets tab, you can add several data view and rendering components, among which we highlight:
- Label: Short and static text.
- Text: Long text, it can be formated with HTML TAGS.
- Dynamic Text: Dynamic text provided from Data Set.
- Image: Adding images.
- Grid: Data formatter in Grid.
- Table: Data table.
- Chart: Pie, line, tube graphs, and so on.
You can add images from the Internet, add file images, or even embed the image in the XML report. In this example, we will use an attached image to show later how to publish reports with attachment.
Drag an Image component to the report, when opening the window Edit Image Item, select the option Image file in shared resources, select the image file in the Enter resource file option and then click the Insert button.
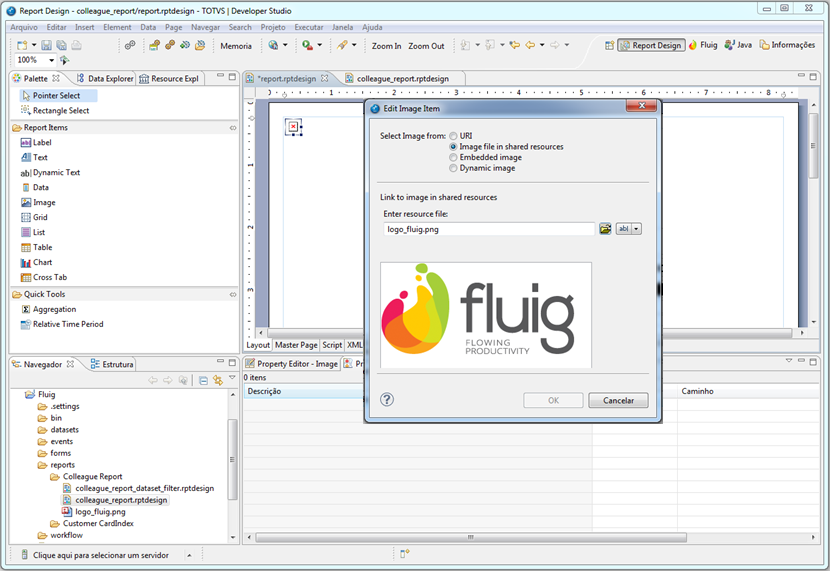
Figura 22 – Image Component
Drag a Text component to the report, when opening the Edit Text Item window, select the HTML option and, in the text area, add the following information formatted in HTML:
<br>
<a href="http://www.fluig.com/">http://www.fluig.com/</a>
<br><b>E-mail:</b> <a href="mailto:[email protected]">[email protected]</a>
<br><b>Telefone:</b> 0800 882 9191
<br>
Then click the OK button as shown in figure 23.
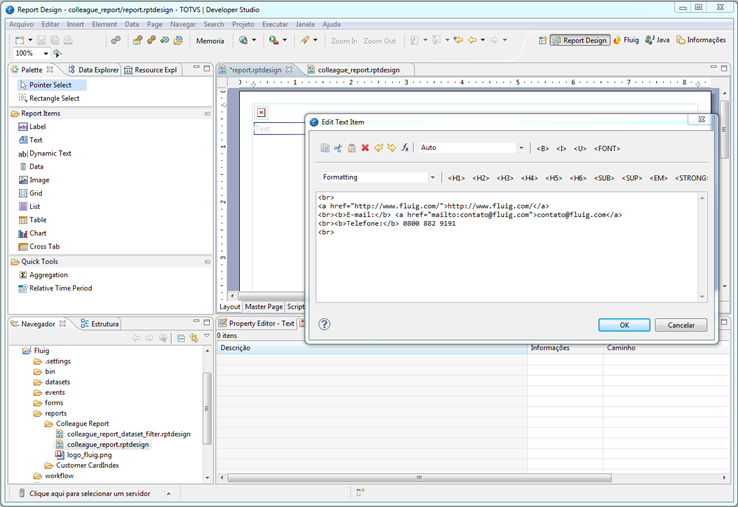
Figure 23 - Text Component.
- Drag a Label component to the report, double-click the component included and type User Report, in the Property Editor - Label -> General tab, define the label format, as shown in figure 24.
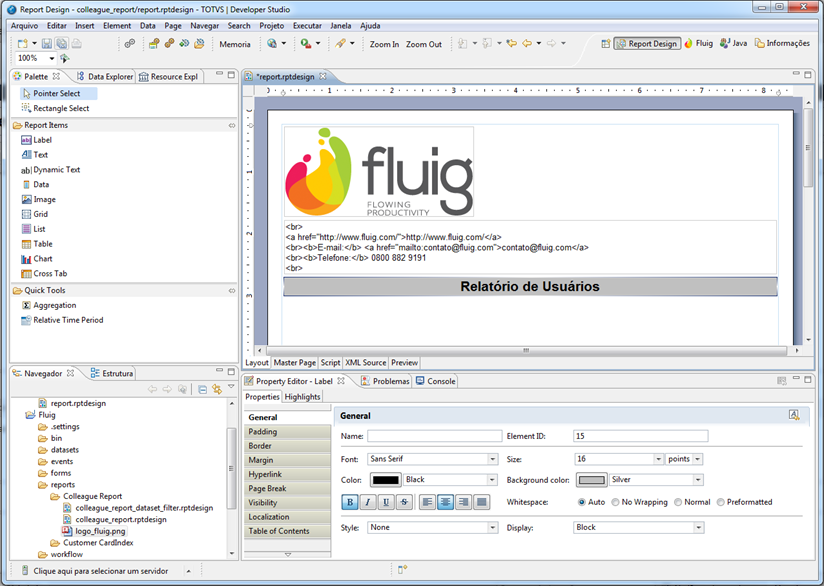
Figure 24 - Report title.
- Drag a Table component, when opening the Insert Table window, define 6 columns and 1 detail, and click the OK button, as shown in figure 25.
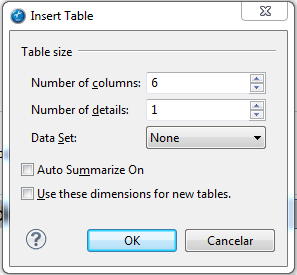
Figure 25 - Table Configuration
In the table added to the report, add a Label component for each column of the Header Row line, define the following values:
- Registration.
- Name.
- Login.
- Email.
- Active.
- Administrator.
Format the labels included by defining font color and background color, as shown in figure 26.
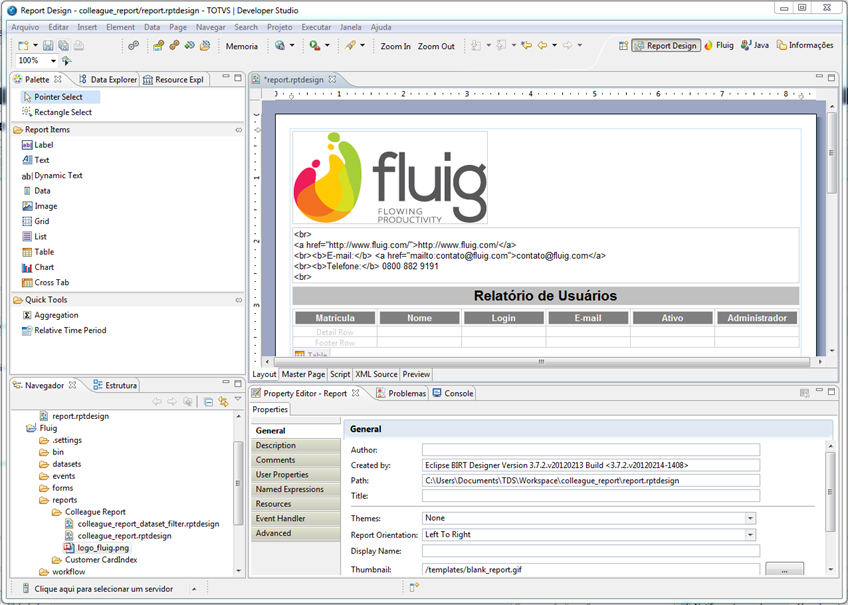
Figure 26 - Column Titles.
Rendering data from Data Set
Select the Data Explorer tab and expand the colleagueDataSet created earlier, then drag each item from the Date Set to the Detail Row column of the table previously created, as shown in figure 27.
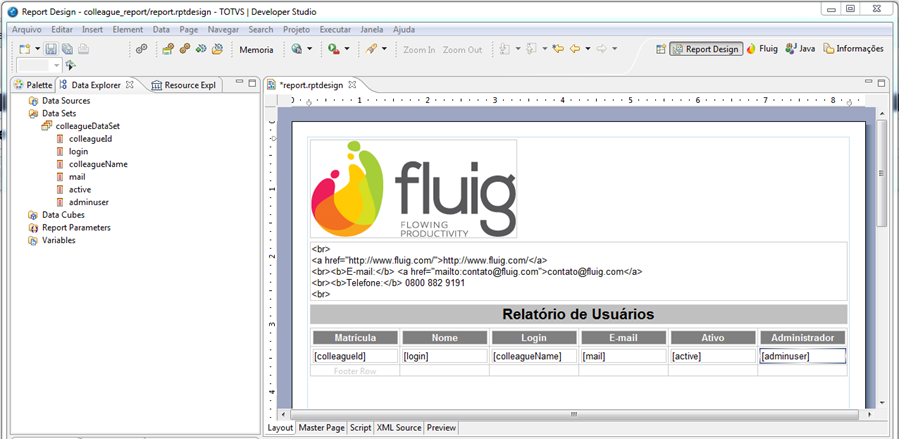
Figure 27 - Data Set.
Posting Reports
Post
Upon completing report development, you need to export it to document browsing.
To do this, right click the report folder and click Export.
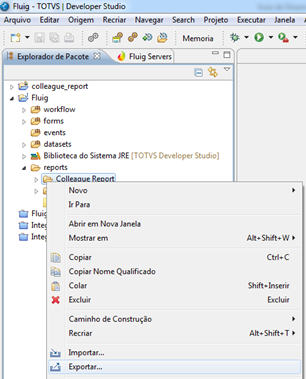
Figure 28 – Report Export.
Nota
Attachments are exported along with the report. During export, the .rptdesign file is automatically identified as the main file, and the other files are classified as attachment.
In the Export screen, click Export to Fluig server and then click Next.

Figure 29 – Report export.
In the Export Report screen, it is necessary to provide the Server name, identify if this will be the posting of a New Report, define the name of the report, the Target Folder (as per image, the target folder code was provided) and then tag the Versioning type (since we are creating a new post, we selected Keep Current).
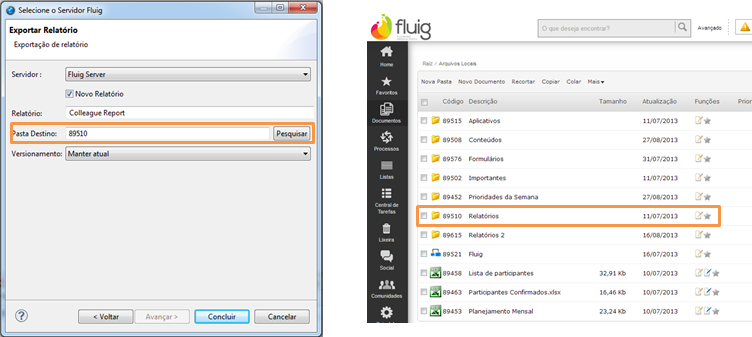
Figure 29 – Report export.
- In the Report folder of Document Browsing, you will be able to see that the report has been published successfully.

Figure 29 – Report posting.
Report Viewer
After finishing the post, to view it, click on the report in the folder where the post was made in Fluig.
A new window should open, to start execution of the user report previously developed, you need to add parameters, define their values, and then click the OK button.
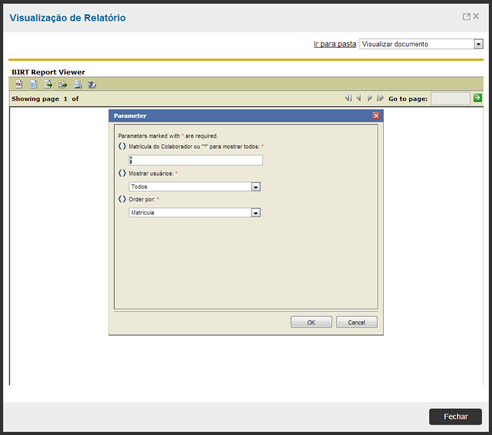
Figure 32 - Report parameters.
The report should display all users registered in Fluig for the company in which the user is authenticated.

Figure 33 – User Report – Result.
Viewer options
Fluig report view tool has several features:
- Check Index: If the developed report has index, you can list it.
- Run report: Allows the report to be executed again.
- Export data: Exports the data generated from the report in file, allowing you to select the desired columns and the data separator.
- Export report: Converts the report data in different file formats: Microsoft® Excel®, PostScript®, PDF, Microsoft® Word, and Microsoft® Power Point® also allow to select the pages that will be exported.
- Print report: Prints report by selecting the printers installed in the authenticated user computer and allows printing in PDF or HTML format.
- Print report in server: Print report from the printers installed in Fluig server.
- Page browsing: allows browsing between the pages of the report.

Figure 34 - Report viewer features.
JPA - Aggregation Functions
Aggregation Functions
Fluig supports through JPA queries and its database, the use of aggregation functions, such as: AVG, SUM, COUNT, MAX and MIN. Also allows you to use groupings: GROUP BY and HAVING
Entity table
The table below refers to the relationship between the dataset code, the JPA persistence entity used in queries, and the respective table in the database. The columns of the persistence entities are the same as those presented in the dataset.
Dataset code | JPA entity | Database table |
AccessLog | AccessLog | HISTOR_ACES |
ActivityDim | ActivityDim | ACTIVITY_DIM_CAP |
advancedProcessProperties | AdvancedProcessProperties | PROPRIED_AVANCAD_PROCES |
businessPeriod | BusinessPeriod | PERIOD_EXPED |
destinationArea | DestinationArea | AREA_DEST |
document | Document | DOCUMENT |
documentSecurityConfig | DocumentSecurityConfig | CONFIGUR_SEGUR_DOCTO |
FactActivityCost | FactActivityCost | FACT_ACTIVITY_COST_CAP |
FactFlowVolume | FactFlowVolume | FACT_FLOW_VOLUME_CAP |
FactProcesCost | FactProcesCost | FACT_PROCES_COST_CAP |
FactProcesVolume | FactProcesVolume | FACT_PROCES_VOLUME_CAP |
FlowDim | FlowDim | FLOW_DIM_CAP |
globalCalendar | GlobalCalendar | CALEND_GLOBAL |
knowledge | Knowledge | KNOWLEDGE |
processAttachment | ProcessAttachment | ANEXO_PROCES |
processDefinition | ProcessDefinition | DEF_PROCES |
processDefinitionVersion | ProcessDefinitionVersion | VERS_DEF_PROCES |
processHistory | ProcessHistory | HISTOR_PROCES |
processState | ProcessState | ESTADO_PROCES |
processTask | ProcessTask | TAR_PROCES |
ProcesVersionDim | ProcesVersionDim | PROCES_VERSION_DIM_CAP |
TimeDim | TimeDim | TIME_DIM_CAP |
topic | Topic | TOPIC |
UserDim | UserDim | USER_DIM_CAP |
workflowProcess | WorkflowProcess | PROCES_WORKFLOW |
Exemplo de Utilização
importPackage(Packages.com.datasul.technology.webdesk.dataset.service);
importPackage(Packages.java.util);

var qd = null;
var rs = null;
var rowMap = null;
var sqlJpa = "";
qd = new QueryDelegate();
sqlJpa = "SELECT count(d.documentPK.documentId), d.publisherId from Document d WHERE
d.documentPK.companyId = ${WKCompany} GROUP BY d.publisherId";
rs = qd.getResultQuery(sqlJpa);
var rowMap = rs.get(0);
//Searches for Count value
rowMap.get("d.publisherId");
//Searches for document Code
rowMap.get("count(d.documentPK.documentId)");
Accessing Form data
Importing libraries
From the DatasetFactory class, it is possible to access form data published in Fluig.
To populate a report through card index data, you need to import the following libraries:
importPackage(Packages.com.datasul.technology.webdesk.dataset.service);

importPackage(Packages.com.datasul.technology.webdesk.dataset);

importPackage(Packages.com.datasul.technology.webdesk.search.controller);
Returning form data
Through the DatasetFactory class, it is possible to search for form data and add filters and order. Use example:
//Mounts the constraints for query
var factory = DatasetFactory.getInstance(${WKCompany});
//Filters Customers 1 to 5
var c1 = factory.createConstraint("cod_cli", "1", "5",ConstraintType.MUST);
var constraints = new Array(c1);
//Orders the result by Customer name
var sortingFields = new Array("name_cli");
dataset = factory.getDataset("cad_cli", null, constraints, sortingFields);
The above example calls upon the getDataset method passing some additional arguments as parameters:
- Dataset Name: Form data service name;
- Fields: Returns only the fields received in the array provided. If null, returns all the fields.
- Constraints: Vector with Dataset search conditions. In each search condition (constraint), you must enter the name of the form field that will be filtered, the start and end value range, and the type of Constraint. These types can be:
- MUST: Indicates that all Dataset records must meet this condition.
- SHOULD: Indicates that the Dataset records may or may not meet the condition. This type is more common when you need the same field to have values A or B (where each will be a SHOULD constraint).
- MUST_NOT: indicates that none of the records can satisfy the condition.
- Sorting: Vector with the list of fields that will be used for arragning the records in the Dataset.
The source of the above-mentioned example can be downloaded from the following link:
Search for Form data with filter by date
To query via Dataset with Date type filters, you must first save the card field in the yyyy/mm/dd format (year/month/day) so you can perform the search via Dataset.
Query example:
//Mounts the constraints for query
var factory = DatasetFactory.getInstance(${WKCompany});
//Filters Customers 1 to 5
var c1 = factory.createConstraint("campo_data", "2010/01/25", "2010/05/02", ConstraintType.MUST);
var constraints = new Array(c1);
//Orders the result by Customer name
var sortingFields = new Array("name_cli");
dataset = factory.getDataset("cad_cli", null, constraints, sortingFields);
Visão Geral
Import HTML Content
Conteúdo das Ferramentas
Tarefas